
News
Stay up to date on the latest crypto trends with our expert, in-depth coverage.

Gold prices edge higher, silver sees gains before U.S. PPI release
101 finance·2026/02/27 13:09

Flare Just Teased Something XRP Holders Have Wanted for Years
TimesTabloid·2026/02/27 13:06
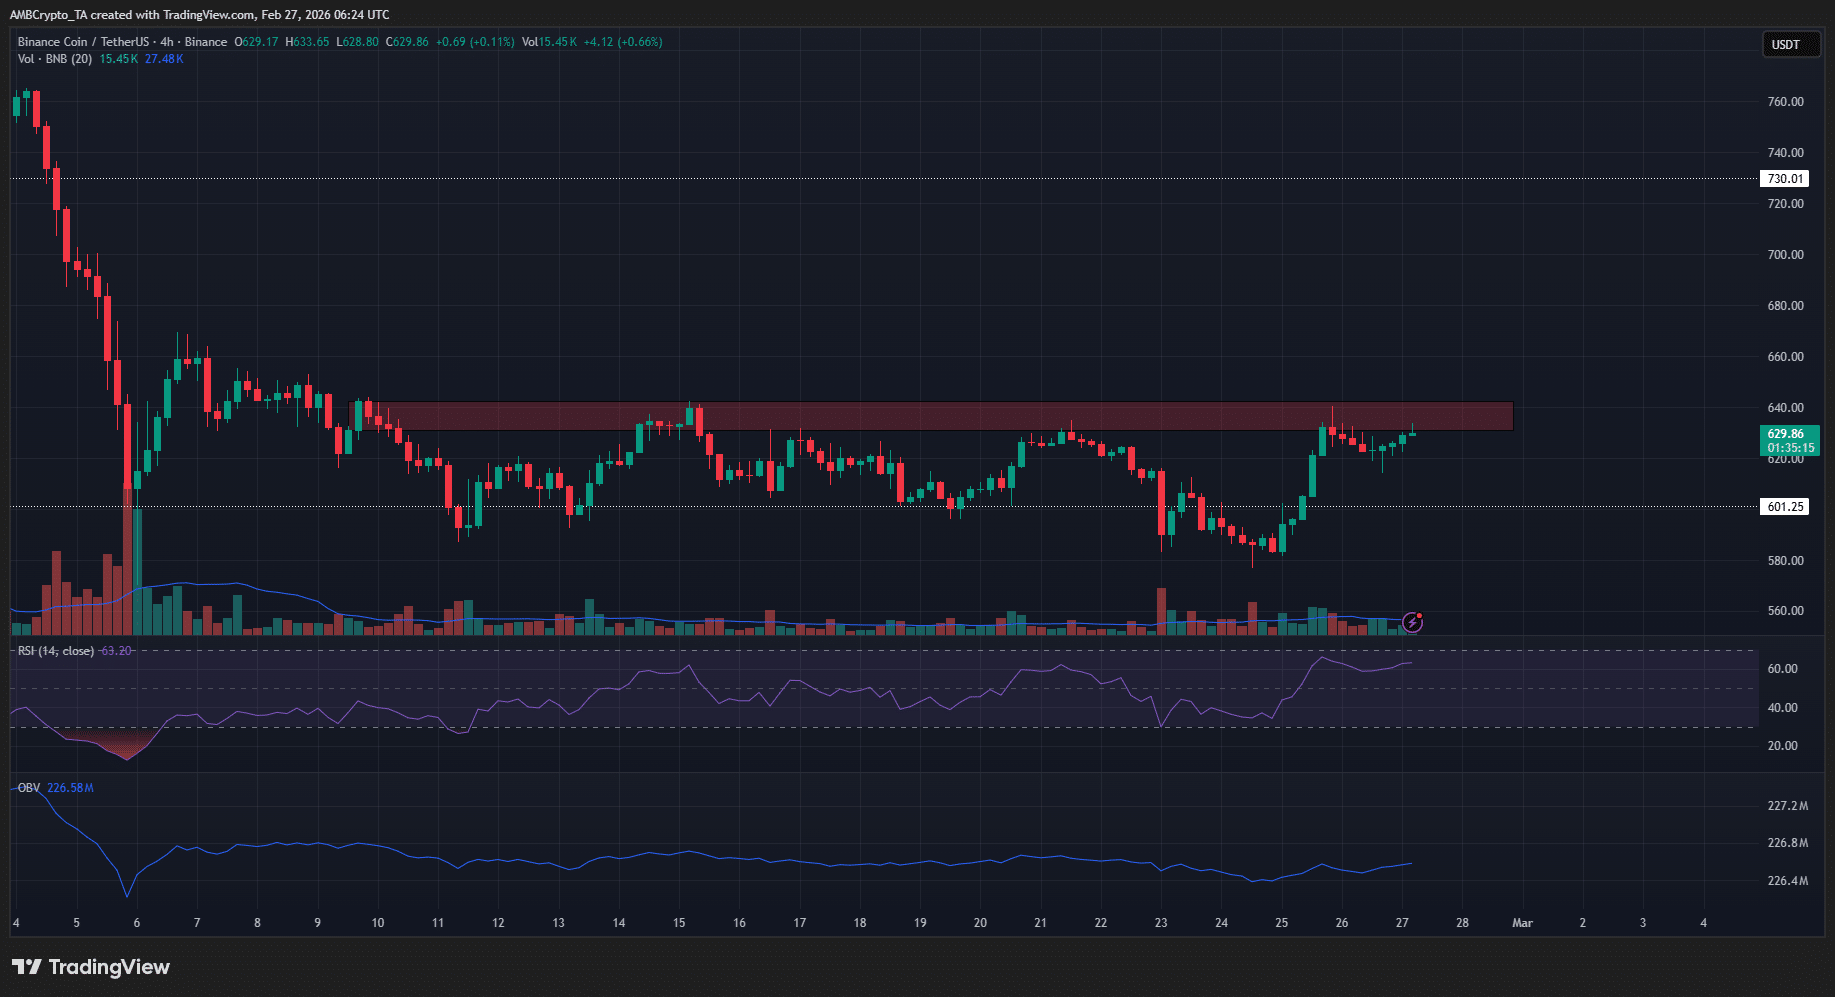
BNB’s $640 barrier under siege: Are bears at risk of a squeeze?
AMBCrypto·2026/02/27 13:03
Bitcoin options traders bet on $90K rebound as analysts flag early signs of market base forming
The Block·2026/02/27 13:00
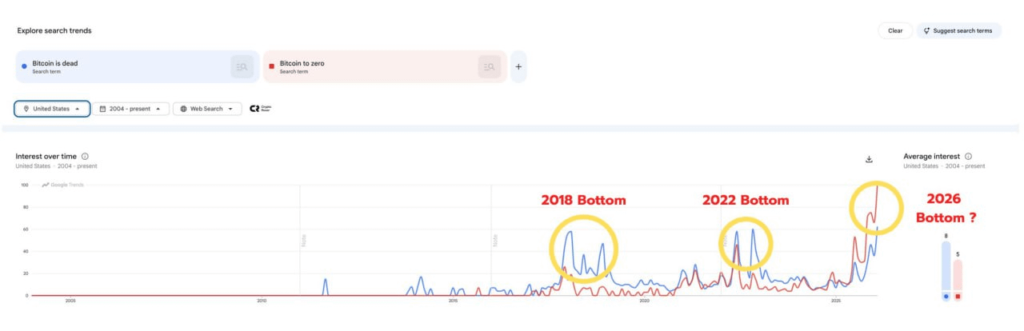
Bitcoin: Google Trends Signals a Shift in User Behavior
Cointribune·2026/02/27 12:45
Egrag Crypto to XRP Investors: Just Do It “You Must Be Buying, Not Crying”
TimesTabloid·2026/02/27 12:33
The sports IP industry can’t defend itself against AI without blockchain
Cointelegraph·2026/02/27 12:33
Japanese Yen surrenders much of its initial advance versus the USD prior to the release of US PPI figures
101 finance·2026/02/27 12:27

MARA Stock Skyrockets 16% Even as the Bitcoin Miner Took a $1.7B
Tipranks·2026/02/27 11:54
When is the US PPI data for January and how could it affect EUR/USD?
101 finance·2026/02/27 11:45
Flash
04:19
Technical Analysis: Spot gold may retest the $4,120 resistance level1. Spot gold may retest the resistance level of $4,120 per ounce. If the gold price can effectively break through this level, it is expected to move further upward, targeting the $4,141 to $4,174 range.2. Currently, the gold price is considered to be operating in the wave c phase, which is the third wave of the irregular flat consolidation pattern since the low of $3,959 on June 25. In theory, this wave has the momentum to extend to the target range of $4,140 to $4,175.3. The pullback triggered by the $4,120 resistance level may have ended, as previously the gold price stabilized near the support level of $4,030. However, if it falls below $4,030, it may trigger further decline, with the target pointing to the $4,000 to $4,015 range.4. From the daily chart perspective, the nature of the current rebound remains unclear. A weak rebound may take two forms: first, as a correction to the downtrend since $4,382, with the rebound possibly ending in the $4,141 to $4,233 range; second, as a correction to the longer-term downtrend since $4,889, with the rebound possibly extending to around $4,382.5. The wave structure shows that the downtrend since $4,889 may be brewing a reversal. This downtrend has exhibited a five-wave structure, where the decline of the fifth wave (wave e) is roughly equal to that of the first wave (wave a), a structural feature that increases the possibility of a trend reversal.
04:05
Analyst: Circulating loss ratio in the current BTC bear market has risen to 54%, potentially surpassing the previous peak```htmlJinse Finance reported that on July 2, crypto analyst Murphy published an article stating that the proportion of circulating losses can be used to compare the "pain level" of investors in each round of bear markets — that is, to measure the extreme range of market sentiment after quantification. Due to factors such as low-cost chips accumulating, bear market bottoms rising, and a more mature holder structure, the proportion of circulating losses at the bottom of each bear market decreases compared to the previous round. For example, the peak value was 64% in 2015, 60% in 2019, and 55% in 2022; and when BTC fell to $58,000 on June 30, this proportion rose to 54%. This is the highest value seen so far in the current cycle. If the declining trend of the past 10 years continues, then 54% is already very close to the previous cycle’s peak; indicating that $58,000 is already very near the bottom.However, recently I've also been thinking about one issue: in this bull market cycle, a large portion of ancient low-cost chips have been moved, and major institutions have taken over at high positions and are still holding large amounts, which has also pushed up the overall cost base for LTH. These chips are now all floating losses, and if they remain unmoved, the base for loss-making chips becomes larger. So, will this break the previous pattern, meaning that the proportion of circulating losses at this bear market bottom will exceed the previous peak of 55%? I think it's possible. But my personal judgment is that even if it exceeds, the difference won’t be too large, probably between 55% and 60%.```
04:05
Analyst: BTC Bear Market Circulating Loss Ratio Rises to 54%, May Exceed Previous Peak On July 2, crypto analyst Murphy stated that the circulating loss ratio can be used to compare the "pain level" of investors in different bear markets, measuring the extreme range of quantified market sentiment. Factors such as low-cost chips being locked in, higher bear market bottoms, and a more mature holder structure have led to a decreasing circulating loss ratio in each bear market compared to the previous one. For instance, the peak in 2015 was 64%, in 2019 it was 60%, and in 2022 it was 55%. As of June 30, when BTC dropped to $58,000, this ratio rose to 54%. This is the highest value observed in the current cycle so far. If the decreasing trend of the past decade continues, then 54% is already very close to the previous peak limit; indicating that $58,000 is near the bottom. However, I have also been pondering a question: during this bull market cycle, a significant amount of ancient low-cost chips has been moved, with major institutions accumulating them at high prices, which has led to an overall increase in the cost center for long-term holders (LTH). These chips are currently at a loss, and if they remain inactive, it will increase the base of loss-making chips. Could this break the past pattern, meaning that the circulating loss ratio in this bear market could exceed the previous peak of 55%? I believe there is a possibility. However, my personal judgment is that even if it exceeds, it won't be by much, likely remaining between 55-60%.
News